

In this article, we tested how tools like GPT-4's improved image generation capabilities and "Napkin AI," which can create diagrams from text, can be used to create diagrams useful for research presentations and paper writing.
Evolution of Image Generation with GPT-4
GPT-4's image generation feature, released on March 25, 2024, has made it possible to generate higher quality images than ever before, such as converting hand-drawn images into professional finishes. While there are still many areas where fine details are challenging, this represents significant progress compared to DALLE, which had become increasingly less useful.
In this verification, we'll introduce how far we can utilize these tools for creating "figures usable in research presentations" with specific examples.
Three Patterns for Using Image Generation AI
There are mainly three approaches to creating diagrams using GPT-4 and image generation AI:
1. Generate images from text
2. Upload hand-drawn sketches and have them refined
3. Create figures by combining text + images (sketches)
Let's explore each method in detail with practical examples.
1. Generating Images from Text
First, let's try creating diagrams from scratch by inputting text.
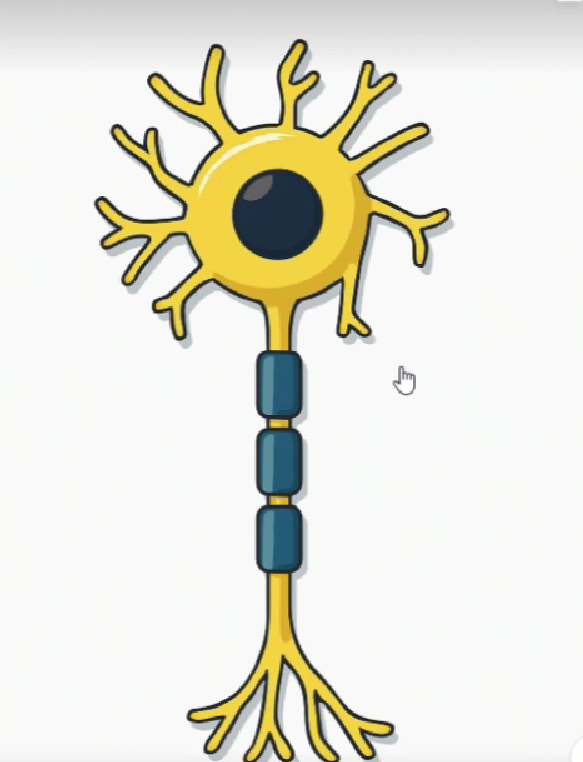
Creating a Neural Cell Network Diagram
As our first example, let's try creating a diagram of neural cells forming a network. The correct structure of neural cell networks can be seen at the following link:

It's an image where dendrites around cells and terminals of other cells form connections called synapses, spreading out infinitely.
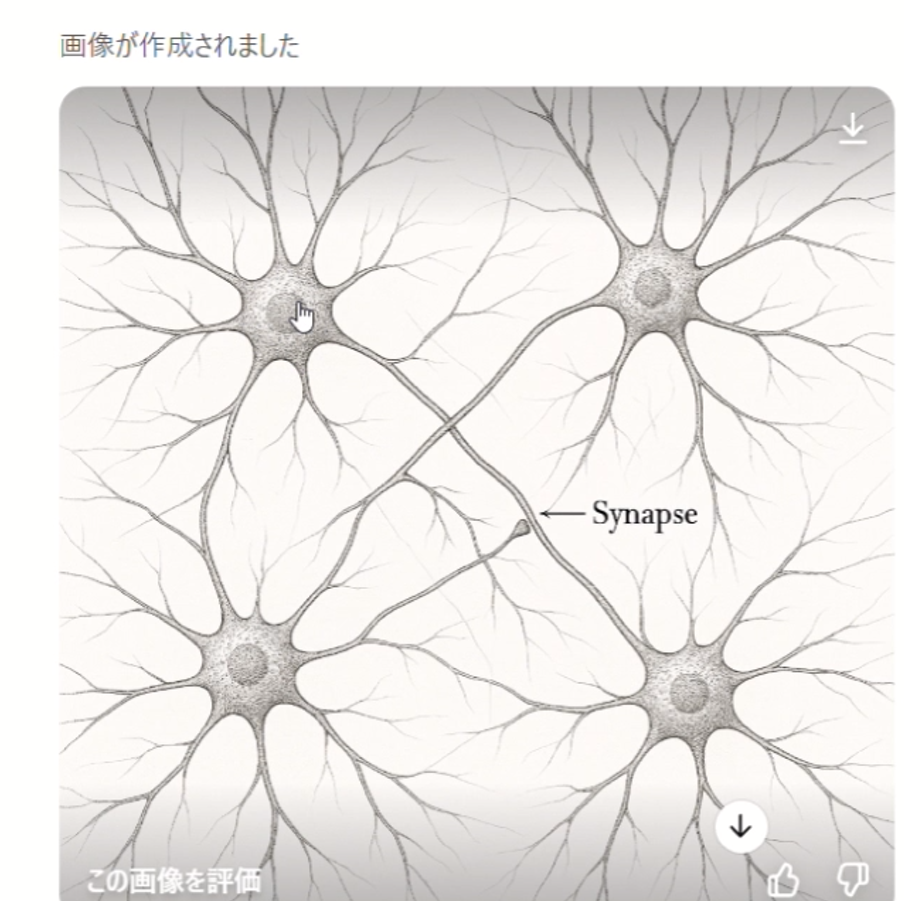
When I instructed it to "create an illustration of neural cells forming networks through synapses," it generated a visually beautiful illustration. However, challenges remain in terms of scientific accuracy.
The positioning of synapses was unnatural, and two cells were incorrectly connected. While it's possible to provide additional instructions for corrections, experience shows this often doesn't work well.
Antibody and Bacteria Diagram
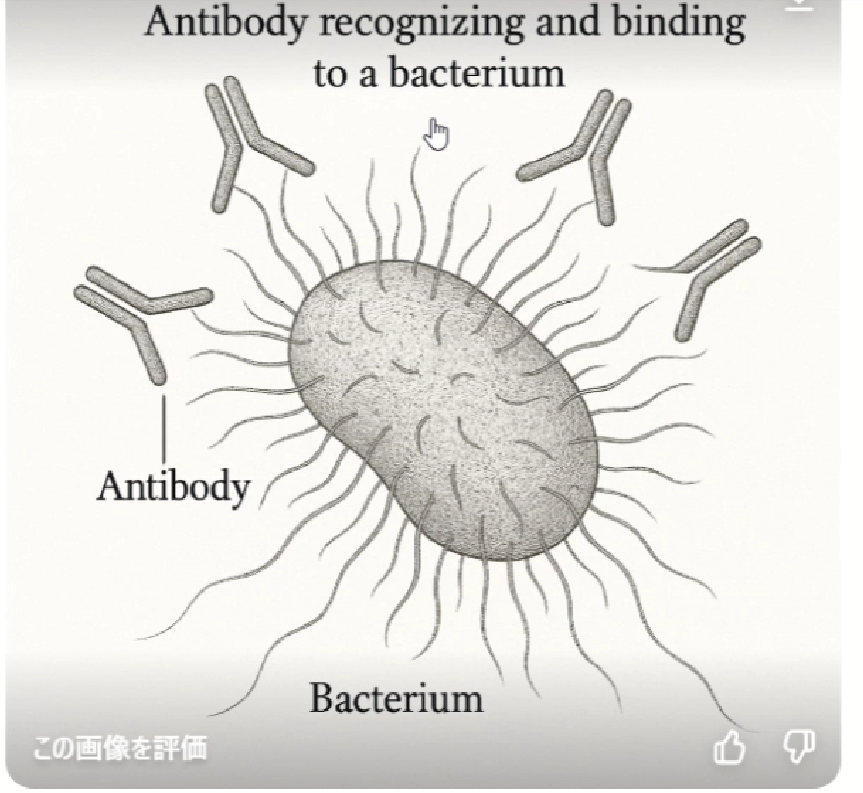
The illustration of "antibodies recognizing and binding to bacteria" also looked good visually, but had inconsistencies in reflecting detailed instructions, such as missing parts. However, the inclusion of English text without spelling errors shows a higher level compared to previous tools. While it's possible to provide detailed correction instructions through text, each correction instruction takes time, making it inefficient.
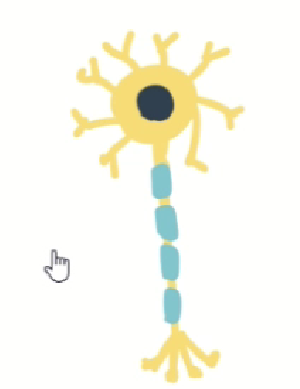
2. Refining from Hand-drawn Sketches
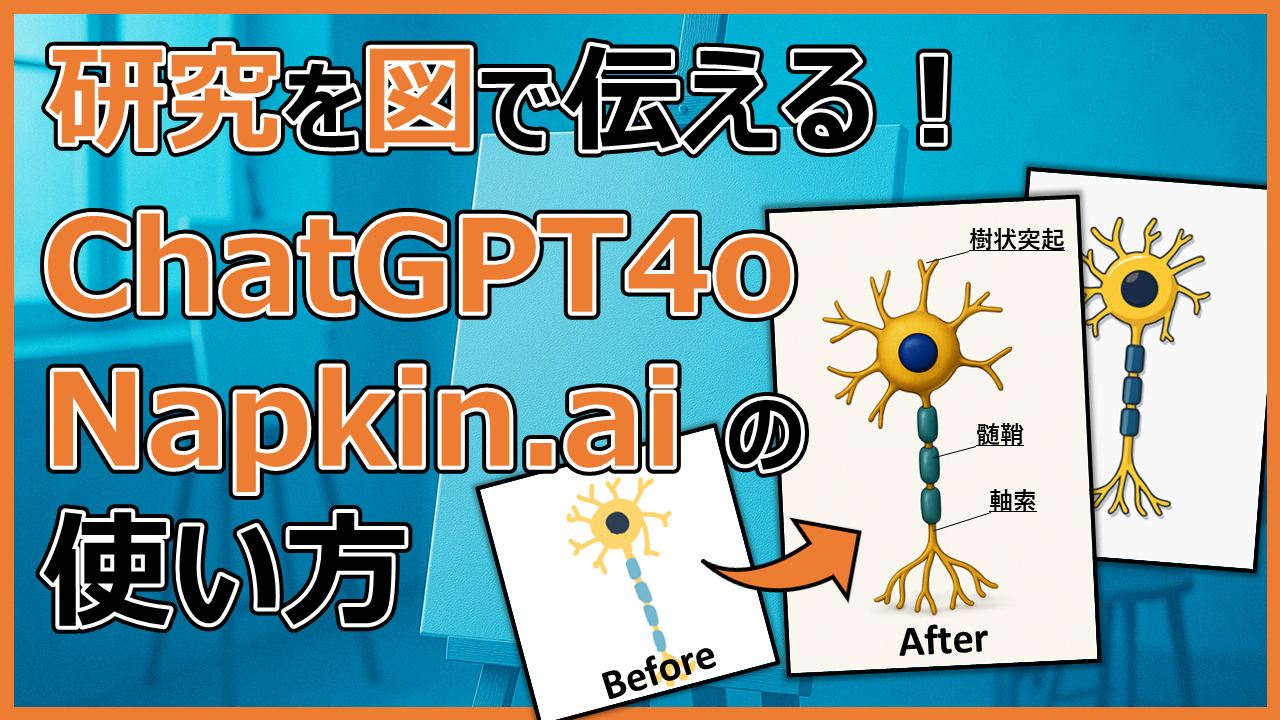
Drawing your own sketch and having AI refine it is effective for reflecting scientific accuracy and intended composition. For example, when instructing a roughly drawn neural cell sketch to be "refined cleanly with no background, keeping the same colors," it respects the original form while tidying up lines and shapes.
▼Before: Basically a doodle
▼After: Refined while preserving the original image. When instructed to "make the background transparent," it does so accordingly.
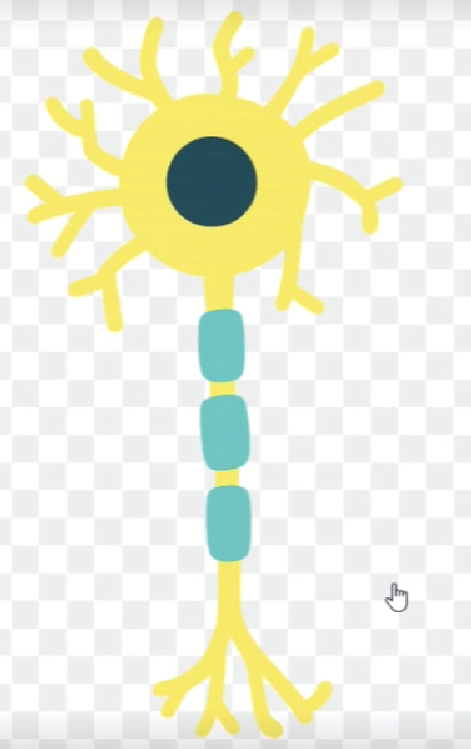
However, it's difficult to strictly specify color consistency and style, so there are some limitations for creating large quantities of unified diagrams required for conference presentations.
Making it More Professional
By giving additional instructions like "make it more like a scientific diagram," it can create more visually appealing diagrams with anime-style or shadowed effects. I certainly couldn't achieve this quality myself! Compared to previous image generation AI, the ability to refine without disrupting the original image composition is a major evolution.
3. Creating Diagrams with Text + Images
When including text in diagrams, instructions like "please add labels to this part" are possible, but labels often aren't placed in the instructed locations, and spelling mistakes in technical terms occur frequently. For example, technical terms like "cell body" and "dendrites" may be misspelled or positioned incorrectly.
I also tested text-included images with English labels, but spelling and placement errors in technical terms occurred frequently. For instance, "mitochondria" became "mitochondrion" in some cases, and positioning of labels was often inconsistent with instructions.
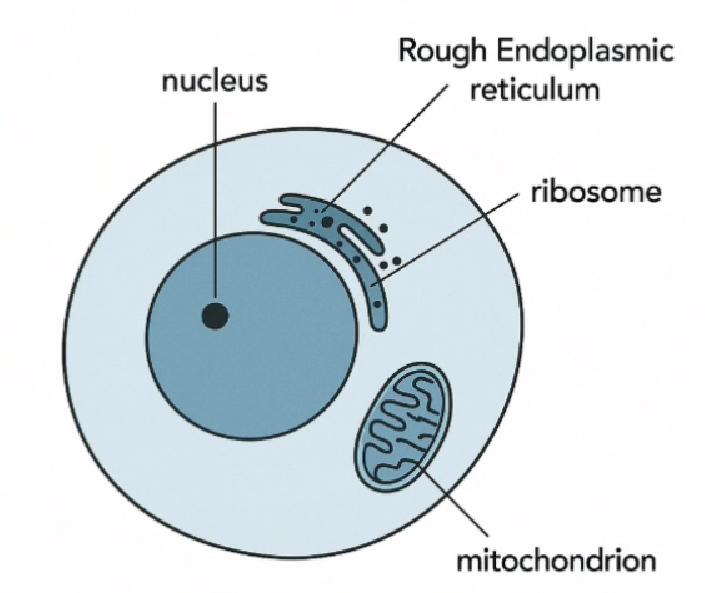
Text insertion was a major challenge for generative AI even just a year ago. Random, nonsensical text would frequently appear. While current results are much cleaner, challenges remain for highly specialized scientific diagrams.
Therefore, it's practical to do final labeling and text insertion using external tools like PowerPoint or Canva.
How Far Can Physics Diagrams Go?
Let's also look at non-biological subjects. For example, how about the mechanics diagram of a "pendulum" commonly seen in physics (below)?
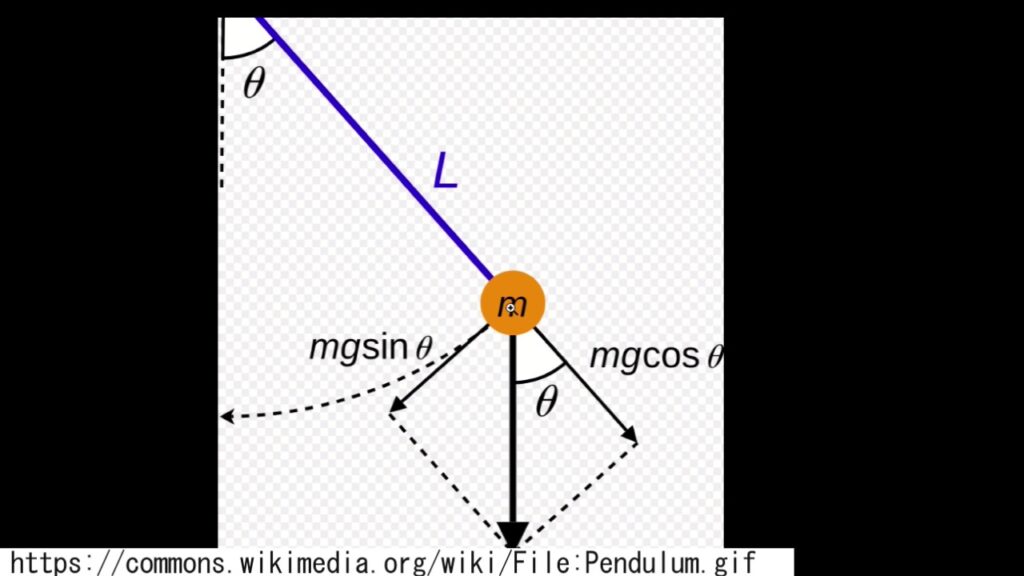
I drew this by hand and requested it to be made into a "clean diagram," but the result was as follows:
▼Overwhelming "this is not what I wanted" feeling
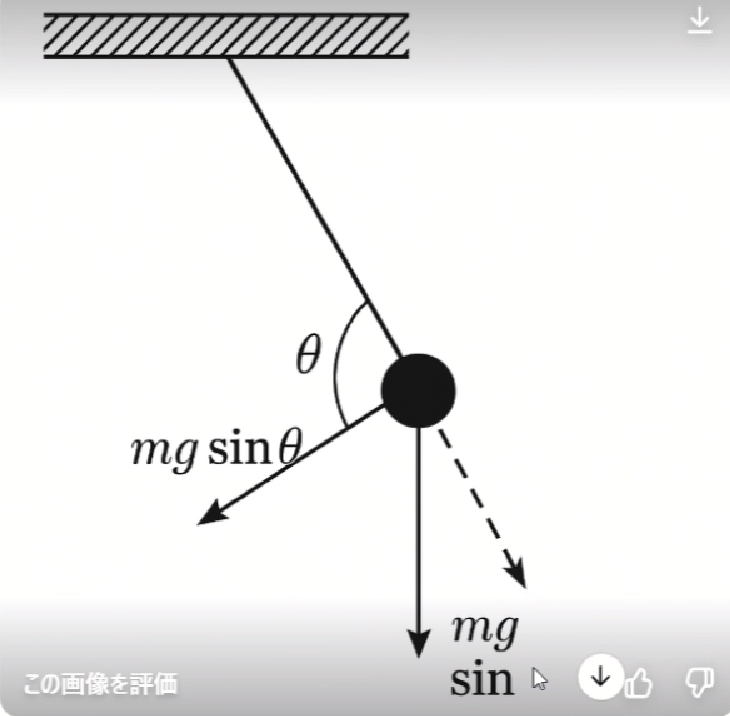
Accurate reproduction was difficult due to incorrect force directions, misplaced labels, and addition of meaningless elements. Even with text instructions like "don't change label positions" and "understand the meaning and draw," it currently seems difficult to grasp detailed intentions.
Creating Simple Flowcharts from Text
I also tried text-based flowcharts. For example, diagramming the content "Research has four stages: literature collection, prior research investigation, hypothesis generation, and experimentation."
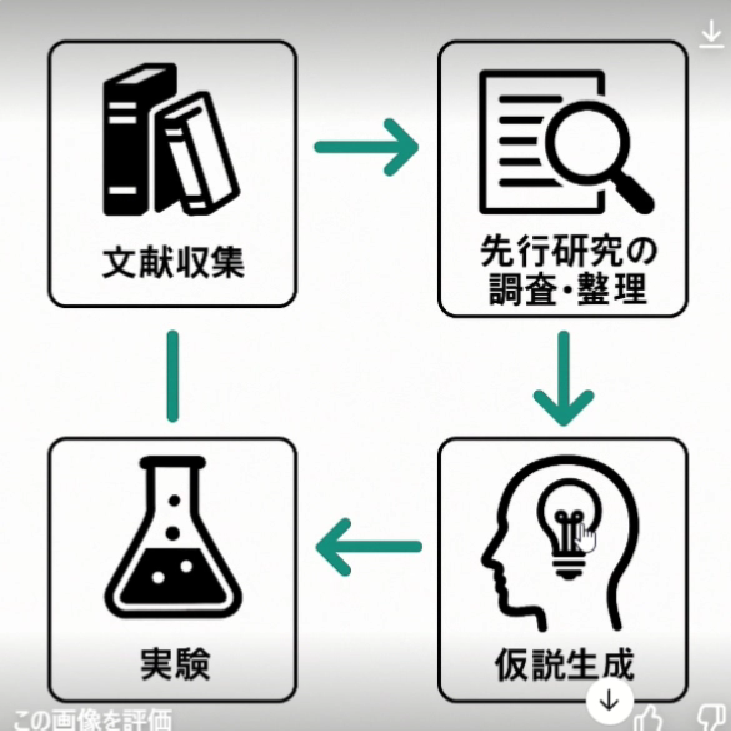
Basic flowcharts can be auto-generated. However, manual corrections are still needed for missing arrows and kanji errors (like incorrect characters in "investigation" and "organization"). Text needs to be pasted over from the top.
Current Recommended Usage of GPT-4 Image Generation AI
【Conclusion】
- To create accurate diagrams, it's practical to upload hand-drawn sketches, have AI refine them, and do final touches in PowerPoint or Canva.
- Don't leave text and labels to AI; always add and correct them yourself.
- Always check technical terms, kanji, and English spelling after generation.
This would be our conclusion. Here, for text-based flowcharts, there were better AI tools available, so let me introduce them next.
Utilizing "Napkin AI" Specialized in Text Diagrams
What is Napkin AI?
Napkin AI is an AI tool that converts text content into easy-to-understand diagrams with one click. It's currently in beta version and most features are available for free.
Actual Usage Experience
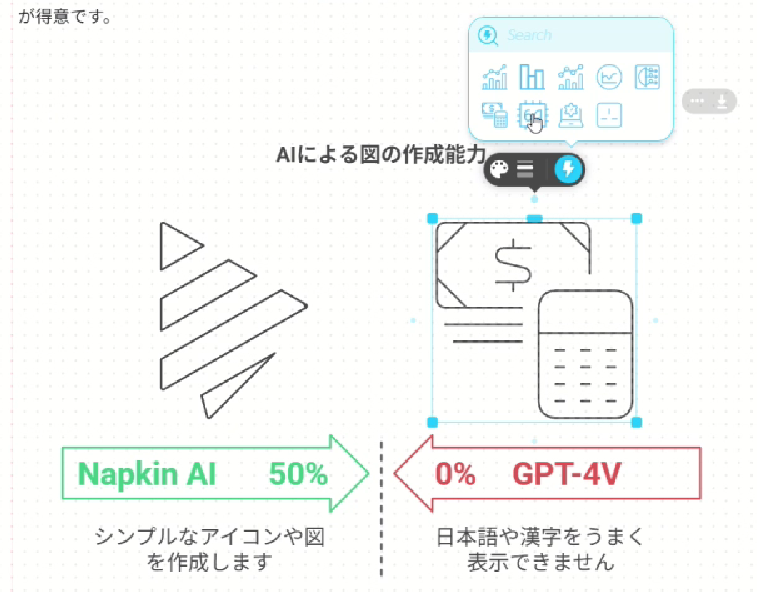
Simply input text and press the "diagram" button, and it automatically breaks down text content into elements and generates visible diagrams. Multiple diagram styles are selectable, and colors, icons, and text content can be freely edited afterwards.
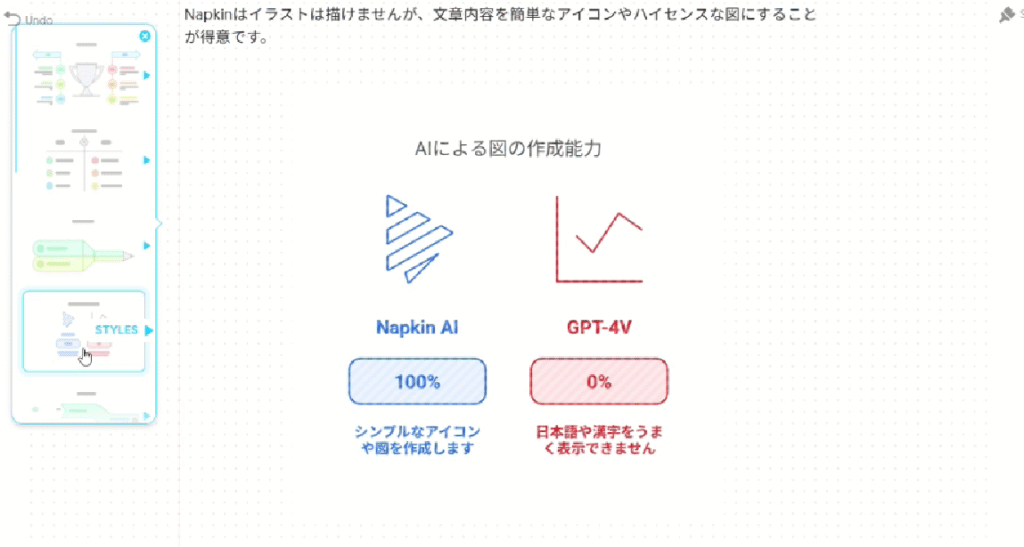
Unlike GPT-4's image generation AI, there are almost no text errors, and editability is high, which is a major advantage. While the example shown here is in Japanese, Napkin AI accurately handles multiple languages including English, making it a versatile tool for international research collaborations and presentations.
It probably uses LLM to summarize written text in multiple ways like bullet points, then applies these to existing templates to create patterns. Very clever!
Recommended for Research, Presentation Materials, and Blog Diagrams
While Napkin AI can't generate illustrations, it's very convenient when you want to quickly and accurately create information-organizing diagrams like "flowcharts," "comparison diagrams," and "matrices." Results can also be output as images, making them easy to use in PowerPoint.
Summary: How to Choose AI Diagram Tools
- Visual illustrations and diagrams based on sketches → Use GPT-4 image generation AI
- Text-based information organization, flowcharts, comparison diagrams → Use Napkin AI
While neither can create perfect diagrams in one go, combining "AI + your manual work" allows you to create higher quality diagrams in less time than before.
The impact of visuals is quite significant, so let's use these tools effectively for presentations, education, and meetings!

コメント